Route own AVD data to Log Analytics Using Custom Logs

🕵️♂️ Situation
During a recent task, I needed to collect specific data from my Azure Virtual Desktop (AVD) session host VMs and send it to an Azure Log Analytics Workspace. The goal was to generate insightful reports for stakeholders. As I started looking into different ways to do this, I came across the Custom Logs feature in Log Analytics, combined with Data Collection Rules (DCR). It turned out to be a simple yet powerful way to collect exactly the data I needed.
📢 Before we start:
- Make sure the Azure Monitor Agent is deployed on VMs.
- ⚠️ Avoid using same Data Collection Rules (DCR) where it collects performance data or Windows Event logs because it doesn’t work well with custom logs, always use a separate DCR for customer logs.
- If you have multiple DCRs you many need to use Azure Policy connect to right DCRs.
- First, know what type of data you want in the table. Because the output decides how we have to build the environment.
📝 What Do You Need?
To set this up, you’ll need:
- A PowerShell script to gather the data
- A Log Analytics Workspace and a Data Collection Rule
- A custom table in Log Analytics Workspace to store the logs
🔧 How Does It Work?
The PowerShell script runs on a schedule inside the VM, collecting data and saving it to a log file in a monitored directory. Then, the Log Analytics Agent automatically picks up the data and forwards it to your Log Analytics Workspace—thanks to the custom log configuration inside the Data Collection Rule.
⚙️ Get the data
In this example I’ll collect the following information from the AVD session hosts using a powershell script.
- Windows OS version
- Windows build number
- Google Chrome version
1
2
3
4
5
6
7
8
9
10
11
12
13
14
15
16
17
18
19
20
21
22
23
24
25
26
27
28
29
30
31
32
33
34
35
36
37
38

# Define log directory and file path
$logDir = "C:\Logs"
$logFilePath = "$logDir\CustomLog.json"

# Create the directory if it does not exist
if (!(Test-Path $logDir)) {
    New-Item -Path $logDir -ItemType Directory -Force | Out-Null
}

# Collect OS version and build information
$os = Get-CimInstance -Class Win32_OperatingSystem | Select-Object Version, BuildNumber, Caption
$osVersion = $os.Version
$osBuild = $os.BuildNumber

$timestamp = Get-Date -Format "yyyy-MM-ddTHH:mm:ssK"

# Collect application versions (check if the file exists before retrieving version info)
$chromePath = "C:\Program Files\Google\Chrome\Application\chrome.exe"

$chromeVersion = if (Test-Path $chromePath) { (Get-Item $chromePath).VersionInfo.ProductVersion } else { "Not Installed" }

# Collect data into an ordered object
$versionInfo = [ordered]@{
    "TimeGenerated"       = $timestamp
    "OSVersion"           = $osVersion
    "OSBuildVersion"      = $osBuild
    "GoogleChromeVersion" = $chromeVersion
}

# Convert the data to a single-line JSON format
$logEntry = $versionInfo | ConvertTo-Json -Compress

# Write JSON data to file
Set-Content -Path $logFilePath -Value $logEntry

Write-Output "Data successfully written to JSON file at $logFilePath"
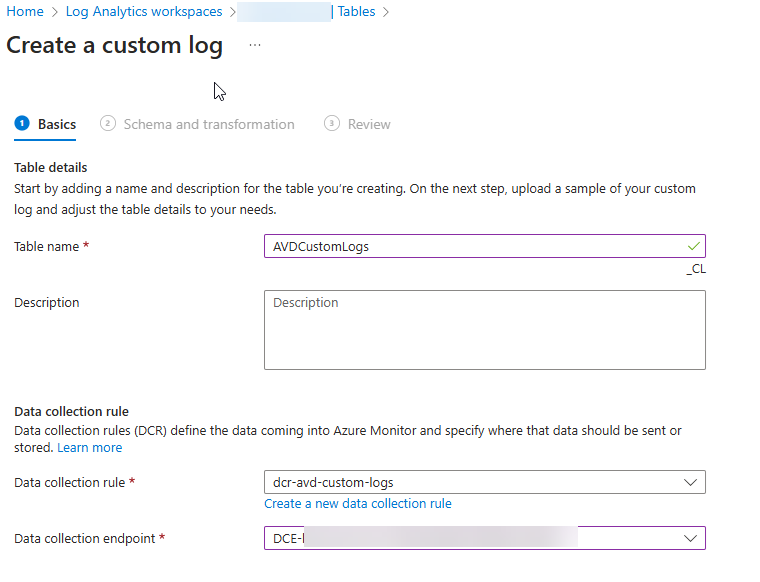
🛠 Create a custom Log Analytics table
To store data, we use a Log Analytics Workspace and we must creaste a new custom Table (DCR-based) along with Data Collection Rule.
- Start the Setup
- Click + Create and choose New Custom Log (DCR-based).
- Name Your Table and Link a Data Collection Rule
- Enter a Table Name and select the Data Collection Rule (DCR) that will handle the log data.
- Create a Data Collection Endpoint
- Provide a Sample Log for Schema Mapping
- Under Schema and Transformation, paste or upload a sample log in JSON format.
- Review and Deploy
Sample Data Set
[
  {
    "TimeGenerated": "2024-03-26T06:48:07.0698295Z",
    "OSVersion": "10.0.22631",
    "GoogleChromeVersion": "132.0.6834.84",
    "OSBuildVersion": "22631"
  }
]
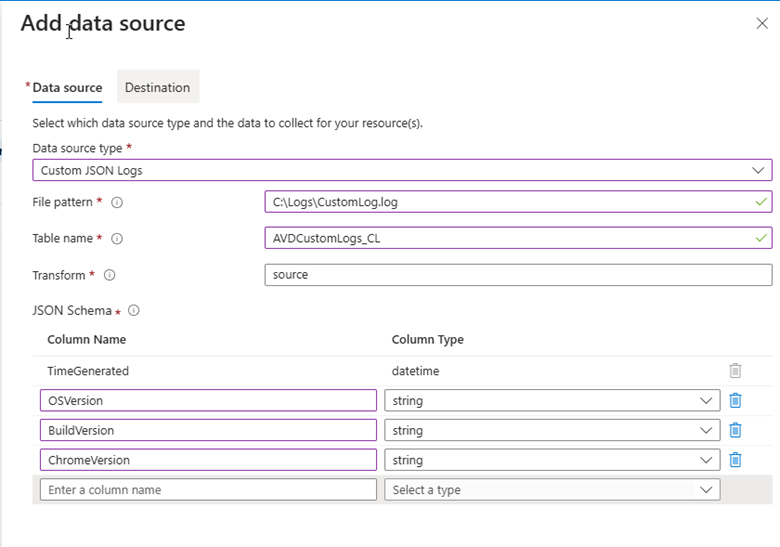
🛠 Data Collection Rule (DCR)
A Data Collection Rule (DCR) is like the brain of data flow, it decides what data to collect, how to process it, and where to send it. Think of it as a smart traffic controller, making sure the right information reaches the right place at the right time.
- Navigate to Data Sources
- Open the previously created Data Collection Rule (DCR).
- Under the Data Sources section, click + Add data source.
- Select the Source Type
- Choose Custom JSON Logs as the source type. (Note: The source type may vary depending on your specific use case.)
- Define the File Pattern
- Define the File Pattern
- Enter the path to the log file, for example:
1
 C:\Logs\CustomLog.log
- Enter the path to the log file, for example:
- Configure Data Transformation
- Select “source” as the transformation option since the schema of the incoming data stream matches the target table.
- If the schema differs, modify the TransformKQL within the ARM template to ensure the correct mapping. Use a KQL query that returns the required schema.
- Define the JSON Schema. See the below table
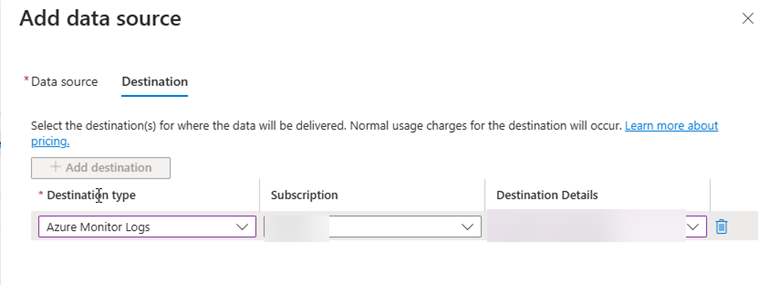
- Select the Destination
- Under Data Source, specify the JSON schema to properly map log fields.
- Select the Destination
- Under Destination, choose the Log Analytics Workspace where you want to store the data.
- Finalize the Configuration
- Click Add Data Source to complete the setup.
| Column Name | Column Type |
|---|---|
| TimeGenerated | DateTime |
| OSVersion | String |
| BuildVersion | String |
| BuildVersion | String |
💡 Note: Once the DCR is created, logs will automatically start flowing into Log Analytics Workspace when the PowerShell script generates new log entries. Note that Default frequency: 5 minutes for custom log collection.
✅ Verify
Now that we have our custom log data flowing into Log Analytics, we can use it to generate insights and you can simply review the data by running KQL query inside the Log Analytics Workspace logs. Examples:
AVDCustomLogs_CL | summarize Count=count() by GoogleChromeVersion | order by Count desc
Once the data is in Log Analytics, you can generate reports, create alerts for outdated OS or Chrome versions, and send notifications. You can even forward the data to a data warehouse for further processing and analysis.SSS
🌟 Summary
In my case, I used Azure Virtual Desktop (AVD) because there was a need to collect system data for reporting and monitoring. However, you might have a completely different case: maybe tracking application performance, analyzing security logs, or something even more creative that I haven’t thought of yet!
The flexibility of Log Analytics and Data Collection Rules (DCR) allows you to adapt this approach to fit your specific needs. I hope this guide was helpful in getting you started. Let me know how you use it in your environment, and I’ll see you in my next post!
Until then, Cheers!